I’ve long established that adding heavy duty analytics and tracking scripts to my blog pages isn’t the right thing to do. Personally, it is also a bit liberating to not know which article of mine is getting a lot of traffic and which isn’t, because then I’m not biased by what the internet is searching for and can write about pretty much anything that I feel like writing about. 10 programming languages you should learn in 2020
has exactly the same weight as Let me tell you a funny story from last night
, so which one do think I’d write about?
The analytics and tracking world has come a long way and is viewed very negatively in the light of recent internet incidents. But it started off very simple and had a very simple and non-malicious idea at its core: Getting to know your user better so that you can serve them better.
That thought made me search for a simple analytics solution that I could run on my blog for a couple of weeks and get enough insights to make informed decisions regarding the frontend design changes while not compromising on the privacy of the visitors. If I’m completely honest, I was also just curious to know these things with no agenda behind it.
I looked into Simple Analytics, a nice solution that does exactly what I needed (perhaps a bit more than that), but a little expensive for me at USD 19 a month. There are also self hosted analytics solutions like Plausible, but that was too much work for realizing this simple thought. So I decided to put something together quickly and the following is what I ended up implementing.
Client side JavaScript
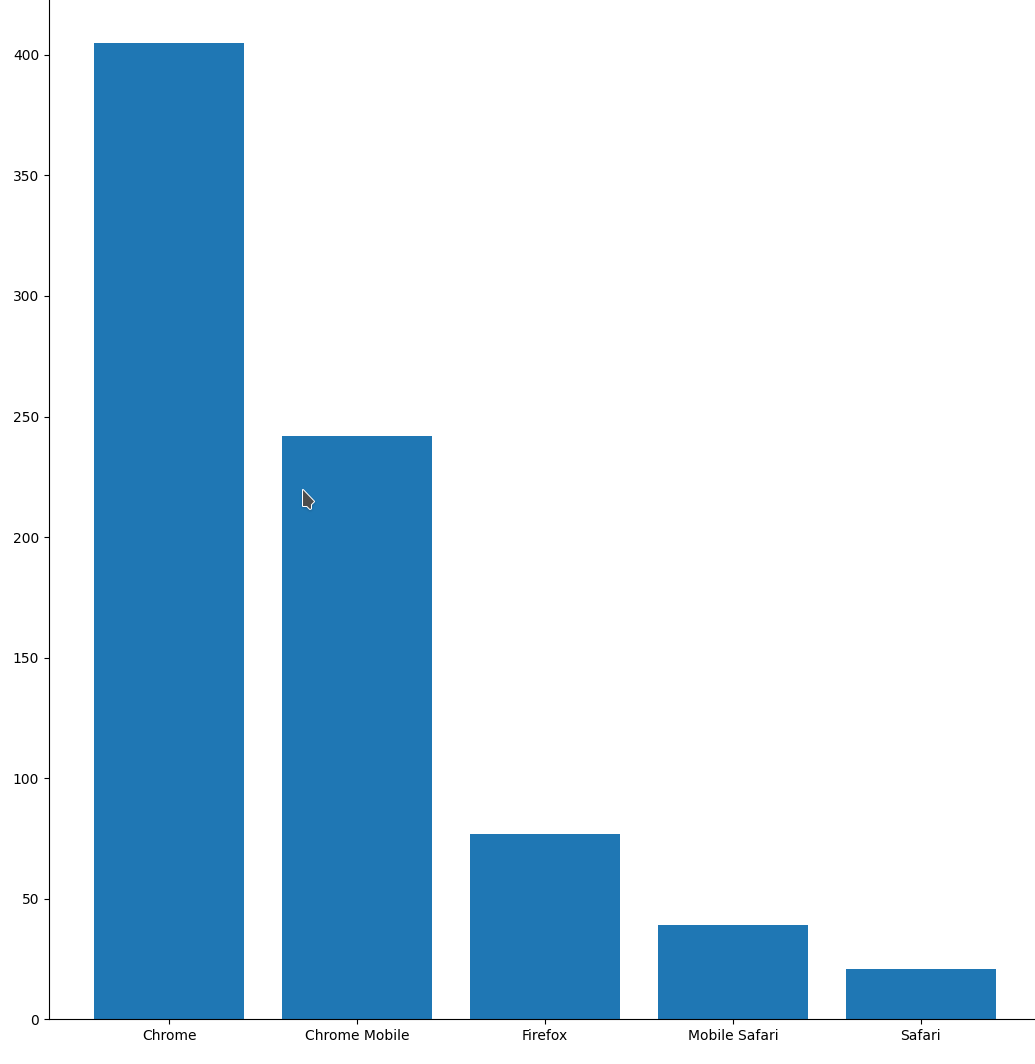
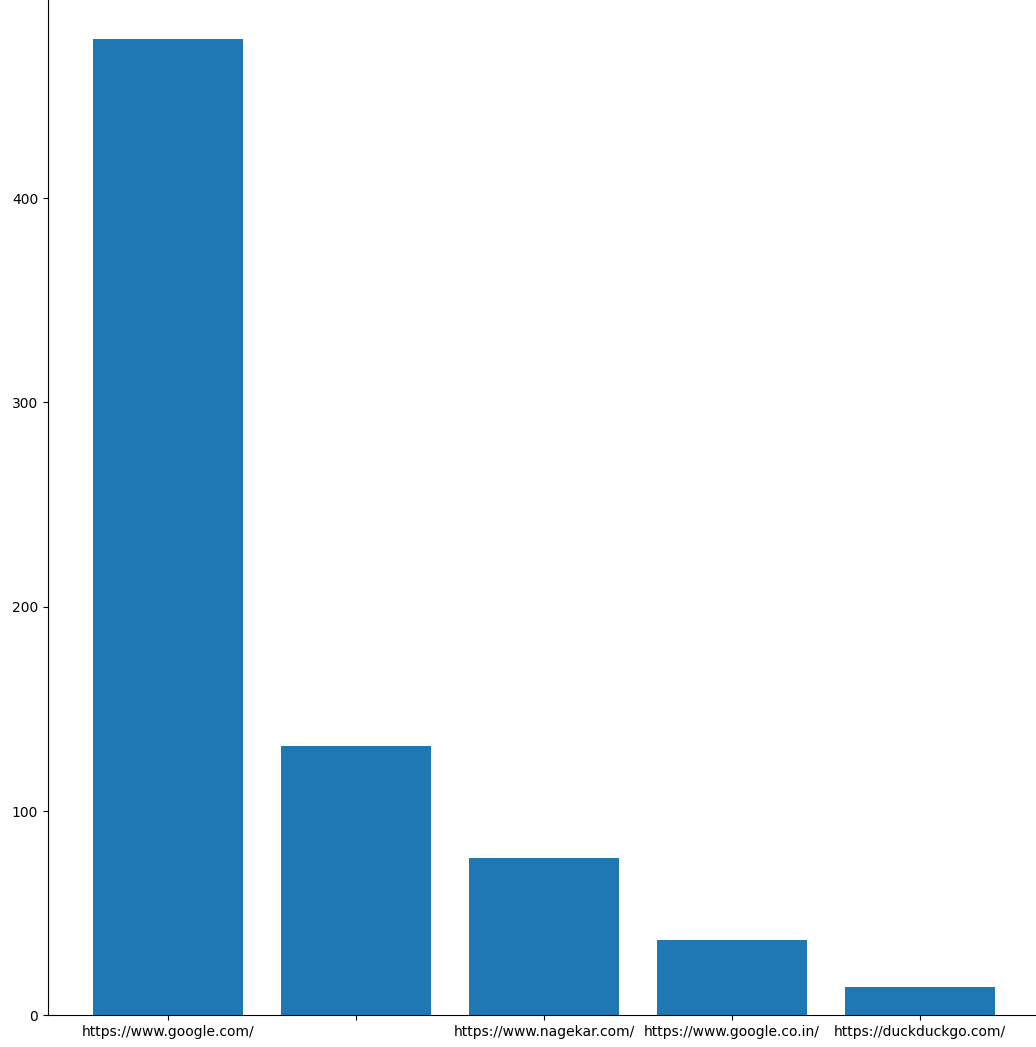
On the client side, I needed to get the data that interested me. It was details like the browsers used by my visitors, platform, width of their screens etc. More technically, the user agent, platform, screen width, referrer and the current page’s url (although I don’t plan on using it for this article. Spoiler: One of my lowest effort articles is pulling more than half of all pageviews which is a bit saddening).
1
2
3
4
5
6
7
8
9
10
11


if (!('doNotTrack' in navigator) || !(navigator.doNotTrack === '1')) {
  let analytics =

  analytics["href"] = window.location.href
  analytics["userAgent"] = navigator.userAgent
  analytics["width"] = window.innerWidth
  analytics["referrer"] = document.referrer
  analytics["platform"] = navigator.platform

  navigator.sendBeacon(ANALYTICS_ENDPOINT, JSON.stringify(analytics
}
There’s not much happening here. Just checking if the user prefers to not be tracked, else get the desired data and POST it to our analytics endpoint using the navigator.sendBeacon API.
Server
We need to implement the endpoint that’s listening for the POST requests from our client browsers. I decided to go with Firebase’s functions for handling the request and Firebase’s realtime database to store the data.
1
2
3
4
5
6
7
8
9
10
11
12
13
14
15
16
17
18
19
20


const functions = require('firebase-functions'
const admin = require('firebase-admin'

admin.initializeApp

const cors = require('cors')({
  origin: true,


exports.handler = functions.https.onRequest(async (req, res) => {
  if(req.method === 'POST') {
    const snapshot = await admin.database().ref('/hit').push(JSON.parse(req.body
    return cors(req, res, () => {
      res.json({ message: 'success'

  }
  else {
    res.json({ message: 'have a good day!'
  }
Now this is super bad code for a variety of reasons, but it worked for my temporary needs. I deployed this, waited for a couple of weeks and had some data to answer some basic questions about my blog’s visitors.
Parsing data
So at this point I had let this code run long enough to have accumulated couple of hundred entries. It was time to analyze. Firebase allows you to easily export the database in JSON format. Using some basic Python-fu, I created lists of each dimension and passed these lists to Python’s builtin collections.Counter (which is perfect since I’m only interested in aggregated stats), and then take the top 5 most frequent items using the .most_common method. Finally, we plot bar charts for these top 5 values across each dimension using Matplotlib to visualize the results.
1
2
3
4
5
6
7
8
9
10
11
12
13
14
15
16
17
18
19
20
21
22
23
24
25
26
27
28
29
30
31
32
33
34
35
36
37
38
39
40
41
42
43
44
45
46
47
48
49
50
51
52


import json
from collections import Counter, defaultdict
from user_agents import parse
import matplotlib.pyplot as plt

analytics_data = defaultdict(list)


def plot_chart_from_ctr(ctr):
    most_common = ctr.most_common(5)
    x, y = [item[0] for item in most_common], [item[1] for item in most_common]
    x = [str(i) for i in x]
    plt.bar(x, y)
    plt.show()


def driver():
    with open('export.json', 'r') as output:
        data = json.load(output)
        hit = data['hit']
        entries = []
        for item in hit:
            entries.append(hit[item])

        analytics_data['height'] = []
        for item in entries:
            analytics_data['width'].append(item['width'])
            analytics_data['href'].append(item['href'])
            analytics_data['platform'].append(item['platform'])
            analytics_data['referrer'].append(item['referrer'])
            analytics_data['userAgent'].append(item['userAgent'])

    browser_family = []
    for agent in analytics_data['userAgent']:
        user_agent = parse(agent)
        browser_family.append(user_agent.browser.family)

    ctr_browser_family = Counter(browser_family)
    plot_chart_from_ctr(ctr_browser_family)

    ctr_platform = Counter(analytics_data['platform'])
    plot_chart_from_ctr(ctr_platform)

    ctr_referrer = Counter(analytics_data['referrer'])
    plot_chart_from_ctr(ctr_referrer)

    ctr_width = Counter(analytics_data['width'])
    plot_chart_from_ctr(ctr_width)


if __name__ == '__main__':
    driver()
The questions
What are the most common browsers?
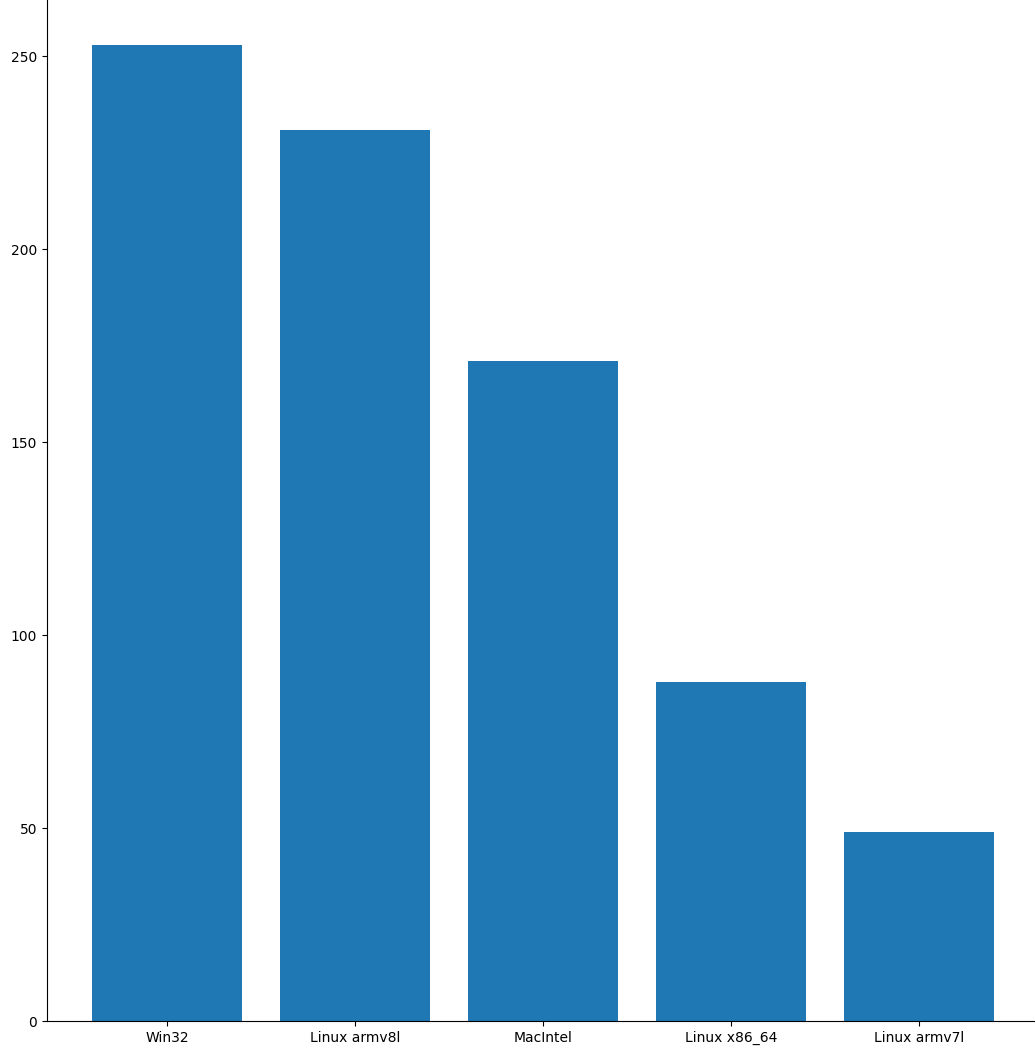
What are the most common platforms?
What are the most common referrers?
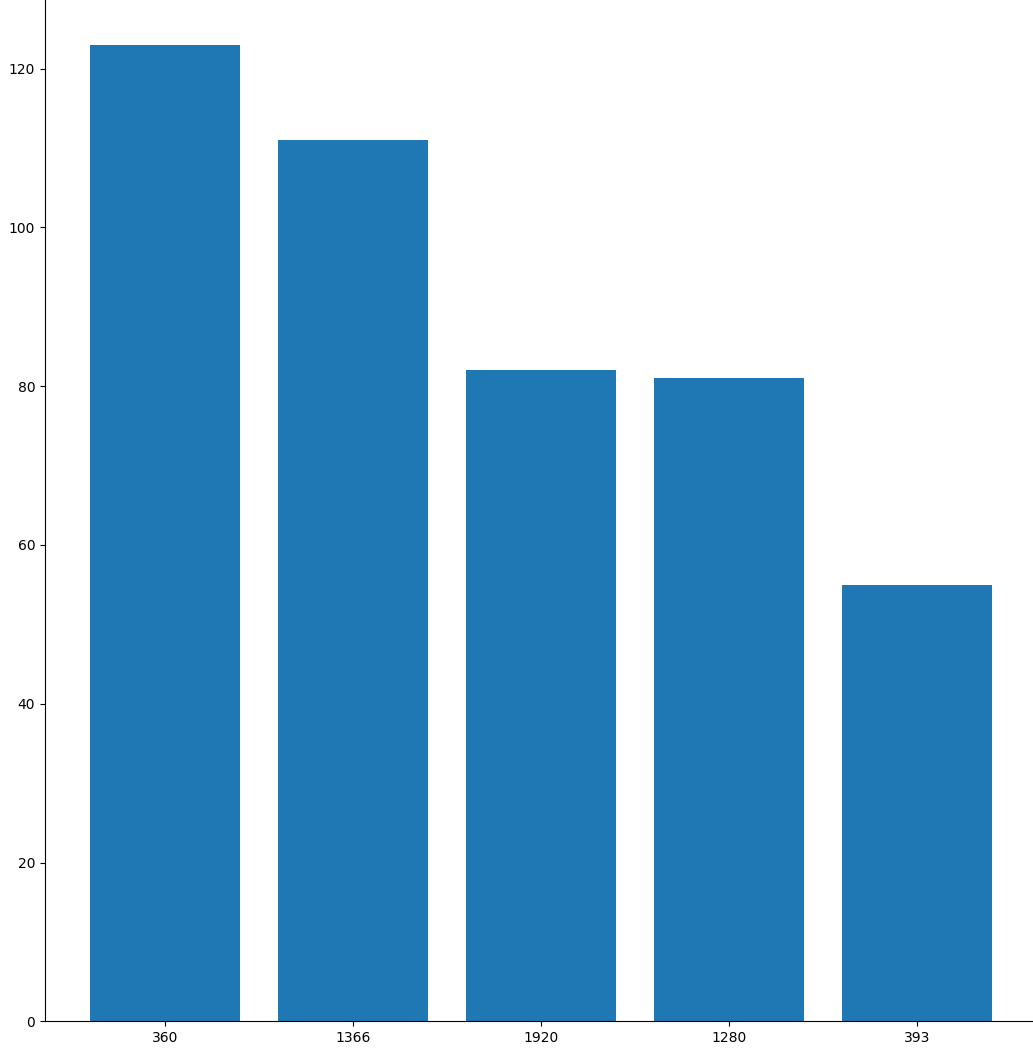
What are the most common screen widths?
In closing
So that’s it for this little article. I’m happy with the outcome given how little effort went into this whole assignment. I hope you enjoyed reading it. As always, write me an email in case you have any comments!
Thank you for reading.