I’ve been seeing people hook up their computers to their cars from quite some time. It is a common sight if you watch any motorsport event on television, where technicians are seen working on their laptops that is connected via a cable to the car or bike. I found it quite fascinating. “What interesting tweaks must they be making to that machine with that computer!” I thought. The idea of tweaking a machine to improve it’s characteristics wasn’t new to me. Overclocking is nothing new. But obviously, since I saw all those professionals do it, I assumed there was no way for such an interface to exist on our everyday road vehicles.
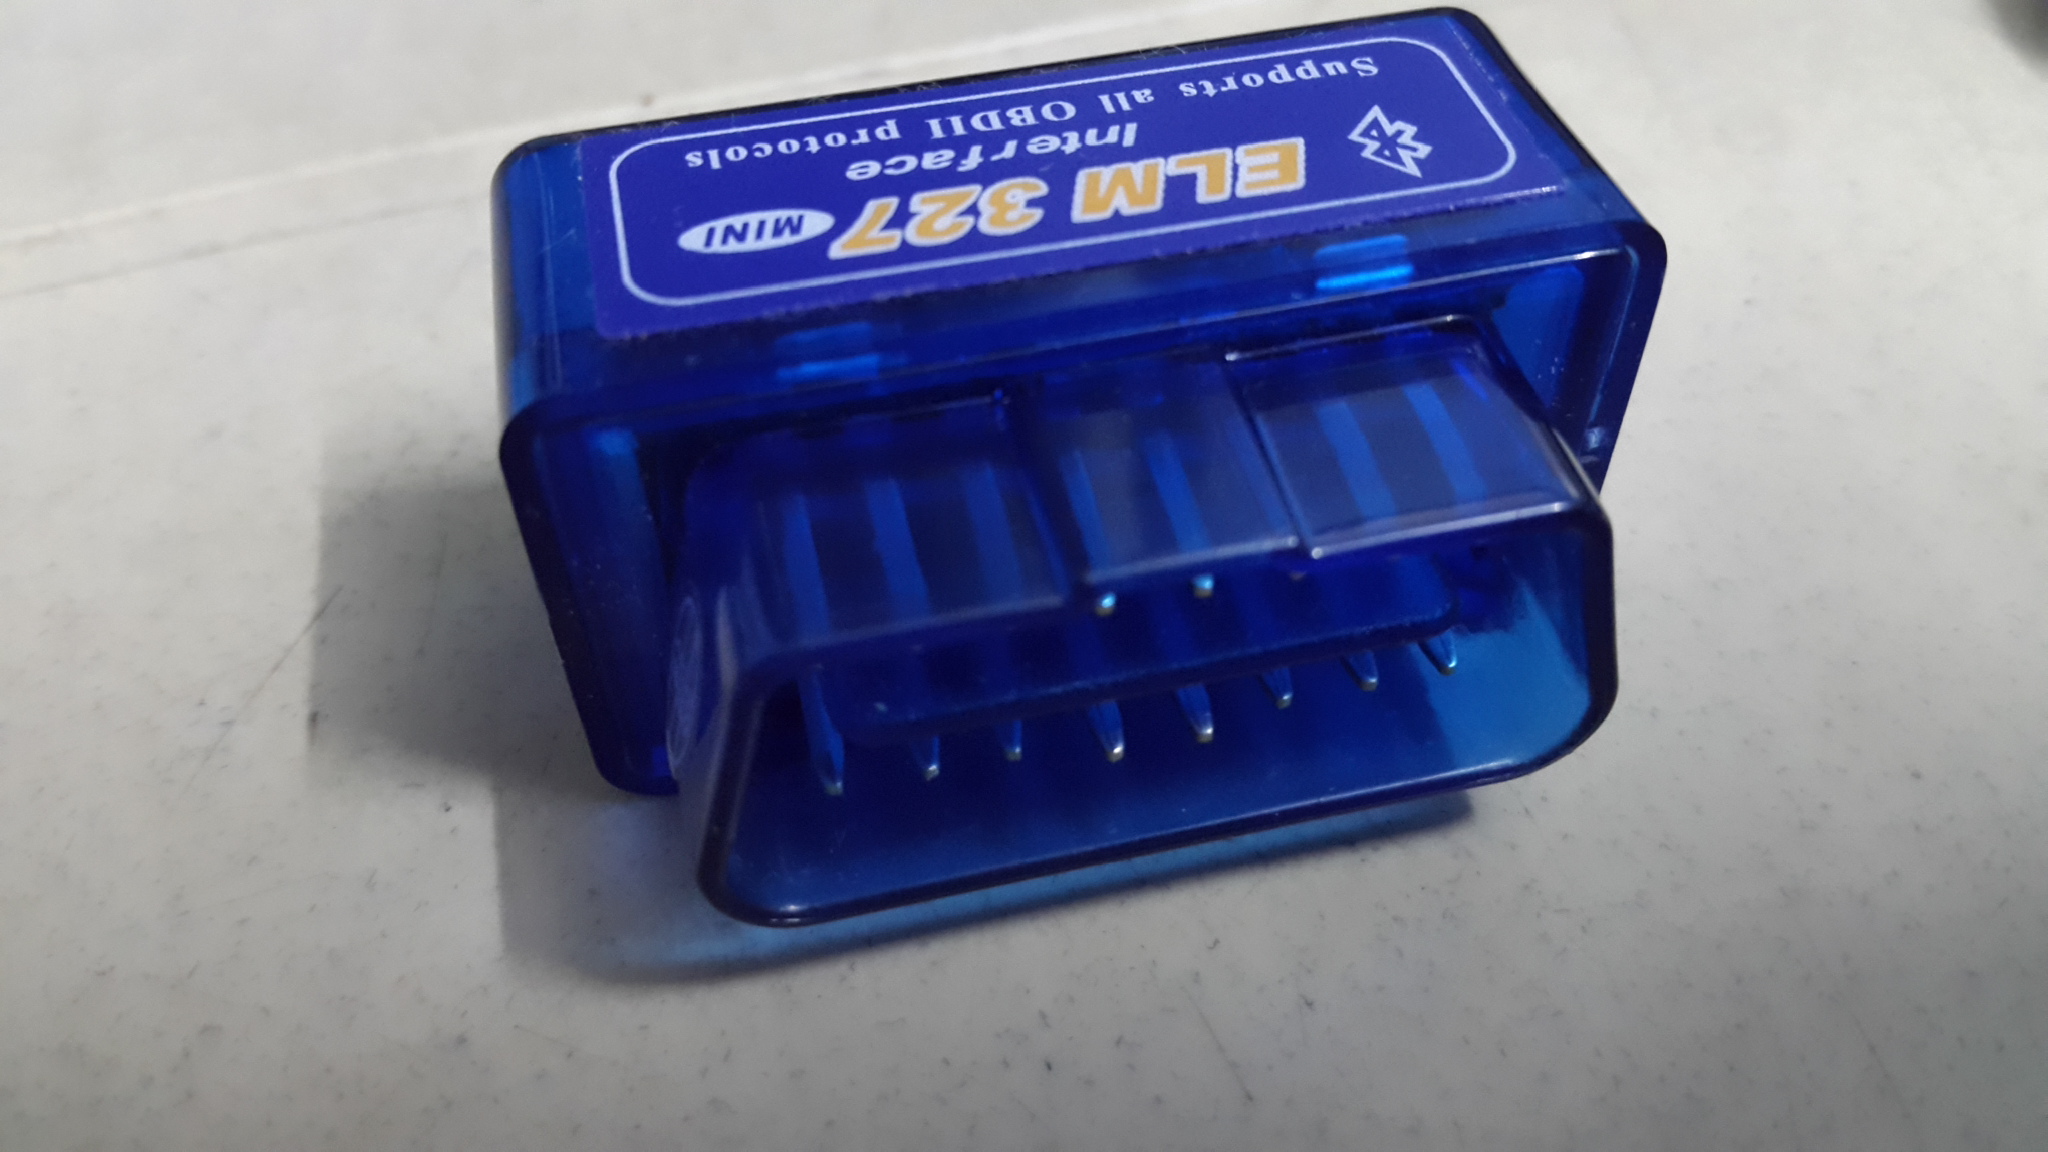
And I was wrong. I discovered that, by law, it was necessary for all cars to have a diagnostics port, called the On-Board Diagnostics port. The latest revision for that port is v2 or OBD-II, and all cars manufactured after 1996 should have one. Also, sometimes, the automotive Youtubers I followed showed various stats on the screens such a the engine rpm, throttle position, boost pressure etc. So that implied there exists a way to extract those stats out of the vehicle’s ECU. Interesting. A quick Google search for “odb scanners” revealed that they’re not very expensive either (with cheap clones available for as low as INR 300, USD 5 or even lower). After researching a bit, I learned that there was loads of data that came out of that little adapter, and that great Android applications (like Torque and DashCommand) exist which spit out the data into beautiful dials and graphs (like the ones on the Nissan GTR ♥) I was awestruck. What more can a nerd ask for!
All this happened a couple of months ago. I knew I needed to get one of those. I waited a couple of months and finally ordered it earlier this month. The first challenge was to find the OBD port. Unlike some other cars, Zacky’s OBD port was hidden behind the fuse box cover, the adapter had to go inside there. I managed to access the port without opening the fuse box and problem solved! Plugged in the adapter, paired with with my phone and it started sending data. That was one of the best feelings ever!
Some of the data it sent that I found particularly interesting to read was
- Boost pressure from the turbocharger
- Engine RPM
- Coolant temperature
- Engine load
- Error codes and provision to reset them
- Horse power, torque, acceleration and other such “calculated” data by combining sensor data with phone’s sensors like GPS and accelerometer and known parameters (like vehicle weight, engine displacement etc)
- and loads of other cool stuff
Note that the available sensor list varies from manufacturer to manufacturer, so keep that in mind. But even with the most basic, the experience is fun. It’s like opening task manager on your computer for the first time. Wow, so I can actually run this h4ck3r stuff, right?
Interesting Learnings
– Negative boost pressure When you start the car and drive it normally, you’ll notice that the boost pressure gauge will read negative (technically, not pressure but vacuum). Only when driving hard (shifting late, for example), will you notice the boost pressure rising. I thought it was some erroneous data from the sensor so I read up a bit. Turns out, at high rpm, the turbo forces the air fuel mixture into the cylinders. But what happens when the turbo is running too slow for compressing air? It simply works as a naturally aspirated engine and sucks in air during the intake stroke. THAT sucking part explains the vacuum. Cool!
– Driving modes So Zacky featured this thing called driving modes. Putting her on “Sports” made the throttle more responsive but reduced fuel economy while putting her in “Eco” did the exact opposite. Now I could’ve told you that this isn’t just marketing and if you test it out, you can even feel a noticeable difference, but that was all I knew. Now, after driving for a while with the boost pressure gauge in front, I made this little observation. When in normal drive mode, the turbo does not spool over 4-6psi boost. But as soon as I go ‘sport’, the turbo goes well over 10psi, even 12 if the sensor is to be believed, which is pretty fantastic.
– A better understanding of the relationship between torque and horsepower, and what each number actually implies. Yes, power is work done per unit time, but what exactly does that feel like. Why do diesels have same horsepower figures even after having loads of torque. It gets really clear once you see the torque, the rpm and the (thus calculated) horsepower figures side-by-side.
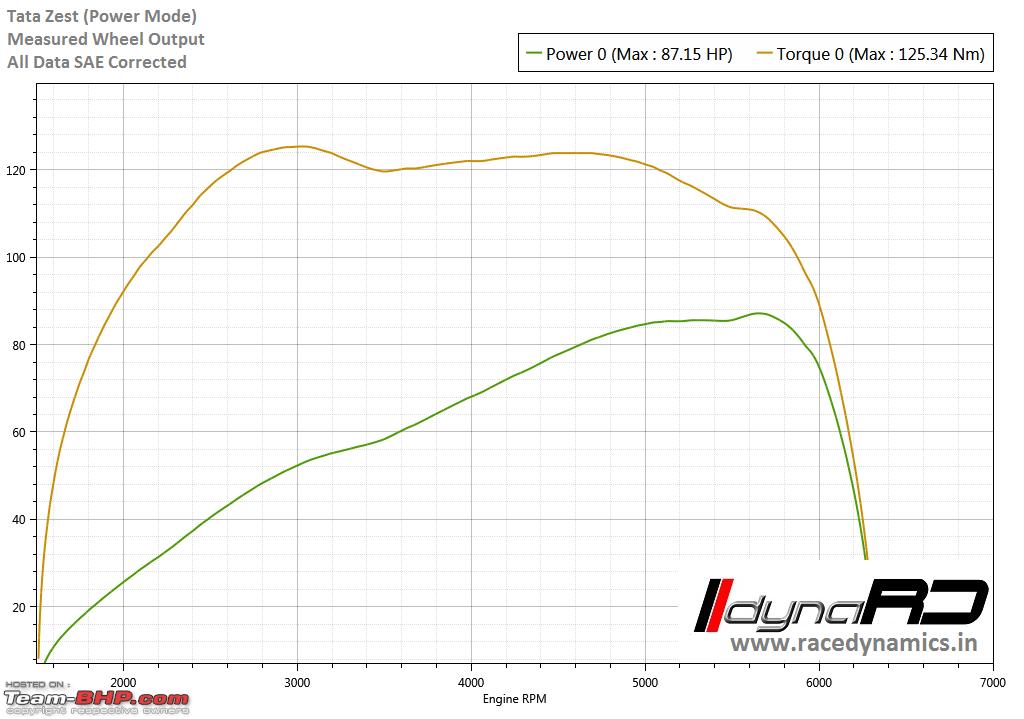
– Torque curve So there’s this thing called a torque curve of an engine, which is just a curve with torque on one axis and RPM on the other. For an IC engine, the torque is not linear (as with electric motors), but a curve with a peak at some specific RPM (or RPM range, which is why a torque (or horsepower) figure is always accompanied by a RPM range), and tapering off at both the ends. To get the maximum acceleration, you have to keep this curve in mind when changing gears.
Now show me some kode!
Yeah, right. So while I was on all of that, I thought, why not study the protocol itself and try writing a little script to pull the raw data from the sensors out, just for fun. Right, but how? This thing is running on Bluetooth, and how do you sniff that. Is there something like Wireshark for bluetooth? Googling “Wireshark for bluetooth” reveals that Wireshark is the “Wireshark for bluetooth”. Damn!
But before wireshark could sniff, I needed to get thing thing connected to my laptop. That’s pretty straightforward. After having it running at /dev/rfcomm0, fire up Wireshark and keep it listening on Bluetooth interface.
Okay, pause. Here’s the funny part. The above text was written some 4 months ago. Then I had to do a lot of physical work to take my laptop into Zacky and do all the research/coding from there. I remember going out at least 3 times, but for some weird reason, never bothered to finish writing this article. I’m putting this out right now so that I will remember to write the part-II for it during the next weekend. Stay tuned.